Debugging is an essential part of the development process, especially when working with PHP. Visual Studio Code, a popular code editor, provides powerful debugging capabilities that can help you identify and fix issues in your PHP code efficiently. In this step-by-step guide, we will walk you through the process of setting up and using the debugging features in Visual Studio Code for PHP development.
First, you need to ensure that you have Visual Studio Code installed on your machine. If you haven’t already, you can download and install it from the official website. Once you have Visual Studio Code up and running, you can proceed to install the necessary extensions for PHP debugging.
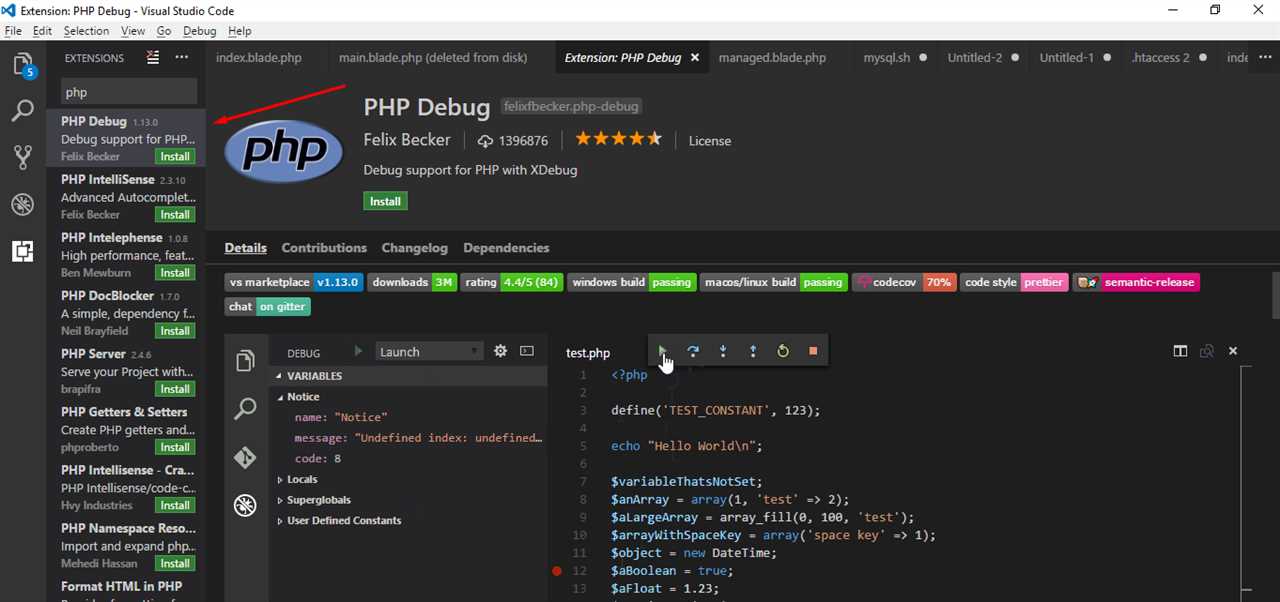
The most commonly used extension for PHP debugging in Visual Studio Code is the “PHP Debug” extension. You can easily find and install this extension from the Visual Studio Code marketplace. Once installed, you will need to configure the extension to work with your PHP environment.
To configure the “PHP Debug” extension, you will need to provide the path to the PHP executable on your system. This can usually be found in the PHP installation directory. Once you have configured the extension, you can start using the debugging features in Visual Studio Code.
With the “PHP Debug” extension configured, you can set breakpoints in your PHP code by clicking on the line number in the editor. When you run your PHP script in debug mode, execution will pause at the breakpoints, allowing you to inspect variables, step through the code, and identify any issues.
Debugging PHP in Visual Studio Code can greatly improve your development workflow and help you catch and fix bugs more efficiently. By following this step-by-step guide, you will be able to set up and use the debugging features in Visual Studio Code for PHP development effectively.
Setting Up Visual Studio Code for PHP Debugging
Debugging PHP code in Visual Studio Code is a powerful feature that can greatly enhance your development workflow. By setting up the necessary configurations, you can easily step through your PHP code and identify and fix any issues.
To get started with PHP debugging in Visual Studio Code, follow these steps:
| Step 1: | Install the PHP Debug extension for Visual Studio Code. This extension provides the necessary tools and functionality for debugging PHP code. |
| Step 2: | Configure the PHP Debug extension by specifying the path to your PHP executable and the path to your PHP.ini file. This information is required for the extension to properly debug your PHP code. |
| Step 3: | Open your PHP project in Visual Studio Code. Make sure that the project is set up correctly and that all the necessary files are included. |
| Step 4: | Set breakpoints in your PHP code. Breakpoints allow you to pause the execution of your code at specific points and inspect the values of variables and expressions. |
| Step 5: | Start the debugging session by clicking on the “Start Debugging” button or by pressing the F5 key. This will launch the PHP debugger and start running your code. |
| Step 6: | As your code runs, it will pause at the breakpoints you have set. You can then use the debugging tools in Visual Studio Code to step through your code, inspect variables, and identify and fix any issues. |
| Step 7: | Continue running your code until you have resolved all the issues and completed your debugging session. |
By following these steps, you can easily set up Visual Studio Code for PHP debugging and take advantage of its powerful debugging features. This will help you save time and effort in identifying and fixing bugs in your PHP code.
Installing the PHP Debug extension

To debug PHP code in Visual Studio Code, you need to install the PHP Debug extension. This extension allows you to set breakpoints, step through your code, and inspect variables while debugging.
Here’s how to install the PHP Debug extension:
- Open Visual Studio Code.
- Click on the Extensions icon in the sidebar (or press
Ctrl+Shift+X). - In the search bar, type “PHP Debug” and press Enter.
- Click on the “Install” button next to the PHP Debug extension.
- Once the installation is complete, click on the “Reload” button to reload Visual Studio Code.
After installing the PHP Debug extension, you’ll be able to start debugging PHP code in Visual Studio Code. Make sure you have a PHP project open in Visual Studio Code, and then follow the steps in the next section to configure and start the debugger.
Configuring the PHP Debug extension
Once you have Visual Studio Code installed, you can start configuring the PHP Debug extension to enable debugging in your PHP projects. Here’s how to do it:
- Open Visual Studio Code and go to the Extensions view by clicking on the square icon on the left sidebar or by pressing Ctrl+Shift+X.
- In the search bar, type “PHP Debug” and press Enter to search for the PHP Debug extension.
- Click on the “Install” button next to the PHP Debug extension to install it.
- Once the installation is complete, click on the “Reload” button to reload Visual Studio Code.
- Now, you need to configure the PHP Debug extension to work with your PHP installation. To do this, go to the Debug view by clicking on the bug icon on the left sidebar or by pressing Ctrl+Shift+D.
- In the Debug view, click on the gear icon to open the launch.json file.
- In the launch.json file, you will see a list of configurations. Find the configuration that says “Listen for XDebug” and make sure it is selected.
- If you don’t see the “Listen for XDebug” configuration, you can add it manually by clicking on the “Add Configuration” button and selecting “PHP” as the environment.
- Once you have selected the “Listen for XDebug” configuration, you can customize it by adding or modifying the properties according to your PHP setup.
- Save the launch.json file and close it.
Now that you have configured the PHP Debug extension, you are ready to start debugging your PHP code in Visual Studio Code. You can set breakpoints, step through your code, inspect variables, and more. Happy debugging!
Setting breakpoints in your PHP code
Debugging your PHP code is an essential part of the development process, and Visual Studio Code provides powerful tools to help you with this task. One of the most useful features is the ability to set breakpoints in your code, allowing you to pause the execution at specific points and inspect the values of variables and expressions.
To set a breakpoint in your PHP code, follow these steps:
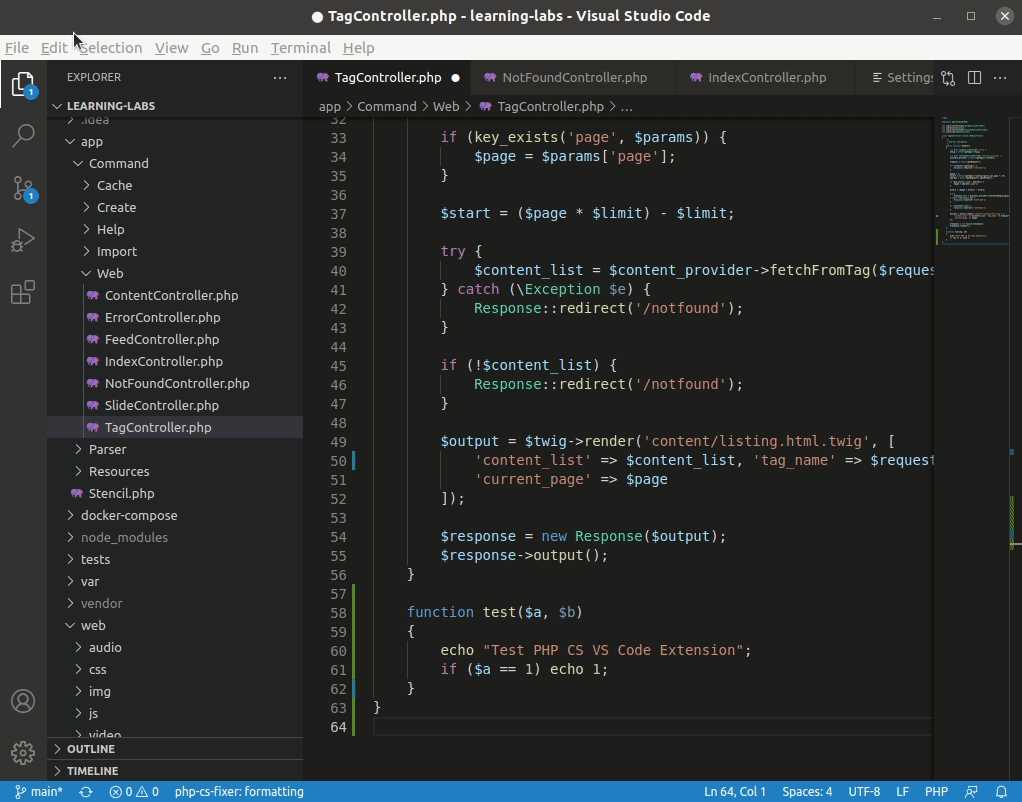
- Open your PHP file in Visual Studio Code.
- Locate the line of code where you want to set the breakpoint.
- Click on the gutter area (the space to the left of the line numbers) to toggle the breakpoint. A red circle will appear, indicating that the breakpoint is set.
Once you have set a breakpoint, you can start the debugging process by clicking on the “Start Debugging” button in the Debug view or by pressing the F5 key. The execution of your PHP code will pause when it reaches the breakpoint, and you can then use the debugging tools to inspect the state of your variables and step through the code.
Setting breakpoints in your PHP code is a powerful way to track down and fix issues in your application. By strategically placing breakpoints in your code, you can easily identify the source of a problem and understand how your code is behaving at different points in its execution.
So, now that you know how to set breakpoints in your PHP code in Visual Studio Code, you can take full advantage of the debugging capabilities of this powerful IDE. Happy debugging!
Starting the PHP Debugging Process

To debug PHP code in Visual Studio Code, you need to install the PHP Debug extension. This extension provides the necessary tools and features to debug PHP code effectively.
Here is a step-by-step guide on how to start the PHP debugging process:
- Open Visual Studio Code.
- Click on the Extensions icon on the left sidebar.
- Search for “PHP Debug” in the Extensions Marketplace.
- Click on the “Install” button next to the PHP Debug extension.
- Once the extension is installed, click on the “Reload” button to activate it.
- Open your PHP project in Visual Studio Code.
- Click on the Debug icon on the left sidebar.
- Click on the gear icon to open the launch.json file.
- Add a new configuration for PHP debugging by clicking on the “Add Configuration” button.
- Select “PHP” as the environment for the new configuration.
- Specify the path to the PHP executable in the “program” field.
- Save the launch.json file.
- Set breakpoints in your PHP code by clicking on the left gutter of the editor.
- Click on the “Start Debugging” button or press F5 to start the PHP debugging process.
- Visual Studio Code will launch a new instance of the PHP runtime and stop at the breakpoints you have set.
- You can now step through your PHP code, inspect variables, and analyze the execution flow to find and fix bugs.
By following these steps, you can easily start the PHP debugging process in Visual Studio Code and efficiently debug your PHP code.
Launching the PHP built-in web server
In order to debug PHP code in Visual Studio Code, you need to have a web server running. One option is to use the PHP built-in web server, which allows you to quickly launch a server without the need for additional software.
To launch the PHP built-in web server, follow these steps:
- Open your project in Visual Studio Code.
- Open the integrated terminal by going to View > Terminal or using the shortcut Ctrl+`.
- Navigate to the root directory of your PHP project using the
cdcommand. - Once you are in the root directory, run the following command to start the PHP built-in web server:
php -S localhost:8000
This command starts the web server on localhost at port 8000. You can change the port number if needed.
After running the command, you should see a message indicating that the web server has started:
PHP 7.4.3 Development Server (http://localhost:8000) started
You can now access your PHP application by opening a web browser and navigating to http://localhost:8000. Any PHP code executed on the server will be displayed in the browser.
With the PHP built-in web server running, you can now proceed to configure Visual Studio Code for debugging your PHP code.
Starting the debugging session in Visual Studio Code
To debug PHP code in Visual Studio Code, you need to install the PHP Debug extension. Once you have installed the extension, follow these steps to start the debugging session:
- Open your PHP project in Visual Studio Code.
- Click on the Debug icon in the sidebar, or press Ctrl+Shift+D to open the Debug view.
- Click on the gear icon to open the launch.json file.
- In the launch.json file, you need to configure the PHP executable and the file you want to debug. Here’s an example configuration:
{
"version": "0.2.0",
"configurations": [
{
"name": "Debug PHP",
"type": "php",
"request": "launch",
"program": "${file}",
"cwd": "${fileDirname}",
"port": 9000
}
]
}
In this example, the “program” field is set to “${file}”, which means it will debug the currently active PHP file. You can also specify a specific file path if needed.
- Save the launch.json file.
- Set breakpoints in your PHP code by clicking on the gutter next to the line number, or by pressing F9.
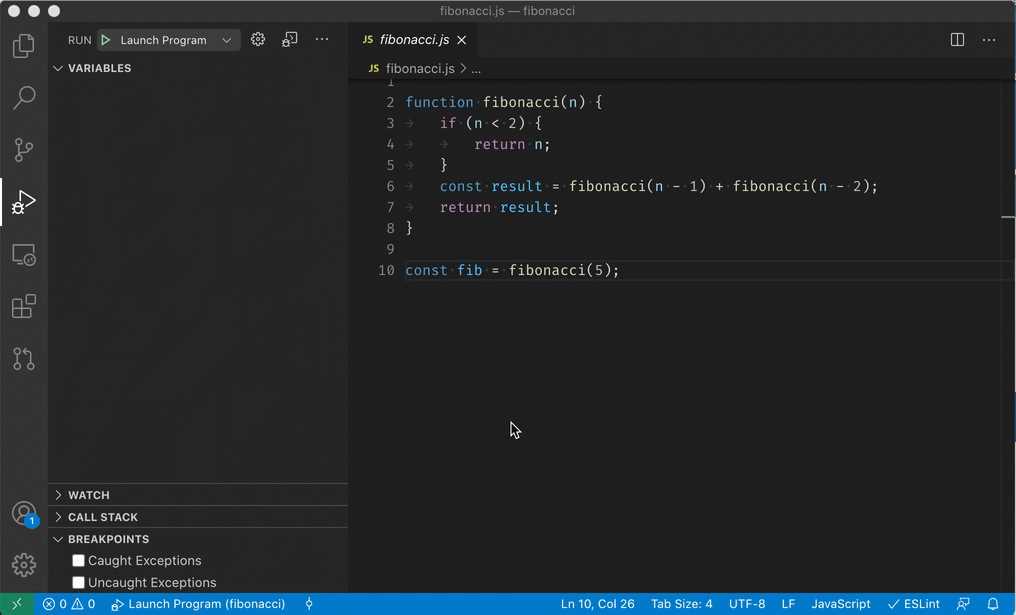
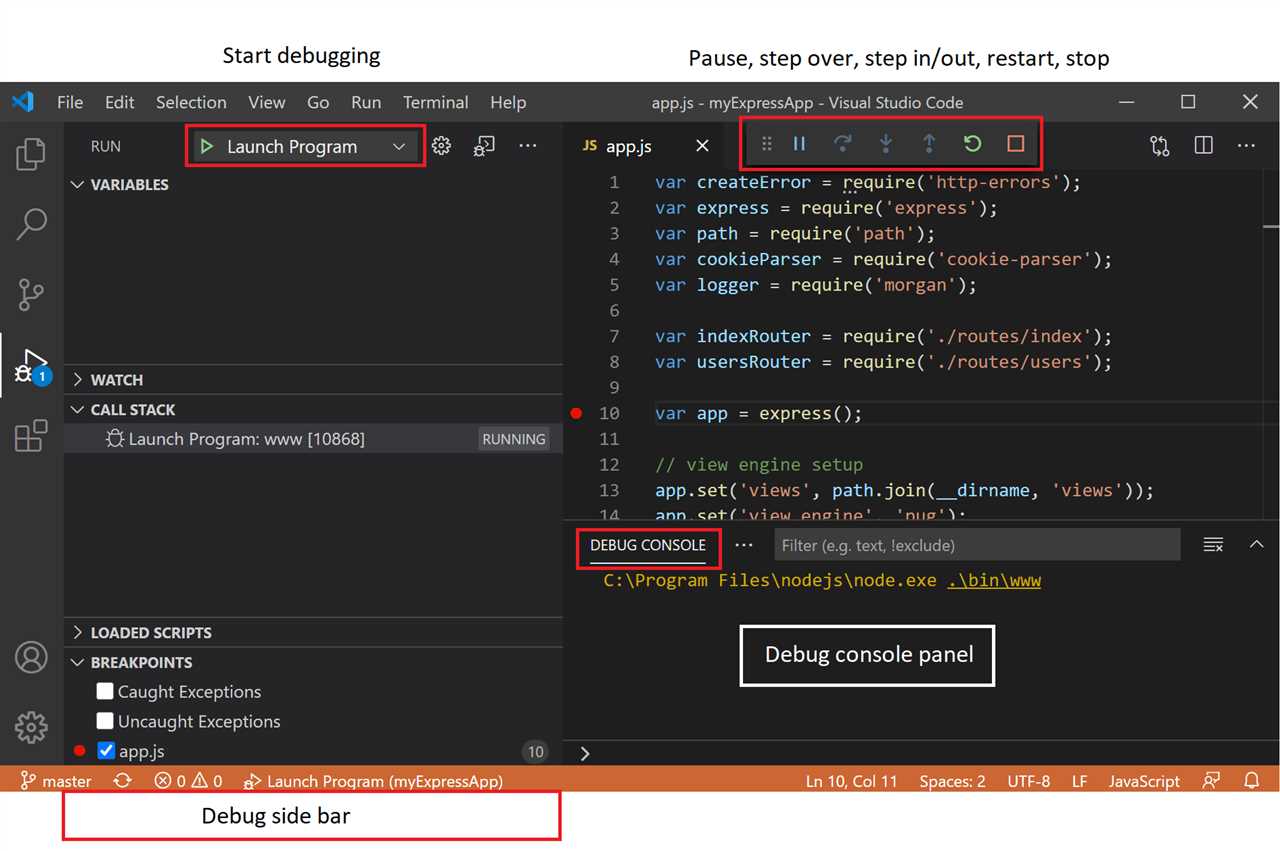
- Click on the green play button in the Debug view, or press F5 to start the debugging session.
- Your PHP code will now be executed in a separate debug console, and you can step through the code, inspect variables, and view the call stack.
By following these steps, you can easily start a debugging session in Visual Studio Code and efficiently debug your PHP code.